Output
Pydamage generates both a tabular and a visual output.
The tabular output is a comma-separated file (.csv) with the following columns, for each analysed reference:
reference: name of the reference genome/contigpred_accuracy: Predicted accuracy of Pydamage prediction, from the GLM modellingnull_model_p0: parameterp0of the null modelnull_model_p0_stdev: standard error of the null model paramaterp0damage_model_p: parameterpof the damage modeldamage_model_p_stdev: standard error of the parameterpof the damage modeldamage_model_pmin: paramaterp_minof the damage model. This is the modelled damage baselinedamage_model_pmin_stdev: standard error of the paramaterp_minof the damage modeldamage_model_pmax: paramaterp_maxof the damage model. This is the modelled amount of damage on the 5’ end.damage_model_pmax_stdev: standard error of the paramaterp_maxof the damage modelpvalue: p-value calculated from the likelihood-ratio test-statistic using a chi-squared distributionqvalue: p-value corrected for multiple testing using Benjamini-Hochberg procedure. Only computed when multiple references are usedRMSE: residual mean standard error of the model fit of the damage modelnb_reads_aligned: number of aligned readscoverage: average coverage along the reference genomeCtoT-N: Proportion of CtoT substitutions observed at positionNfrom 5’ endGtoA-N: Proportion of GtoA substitutions observed at positionNfrom 5’
To select contigs/references with damage, you will most likely want to look at two columns:
pred_accuracy > 0.9andqvalue <= 0.05
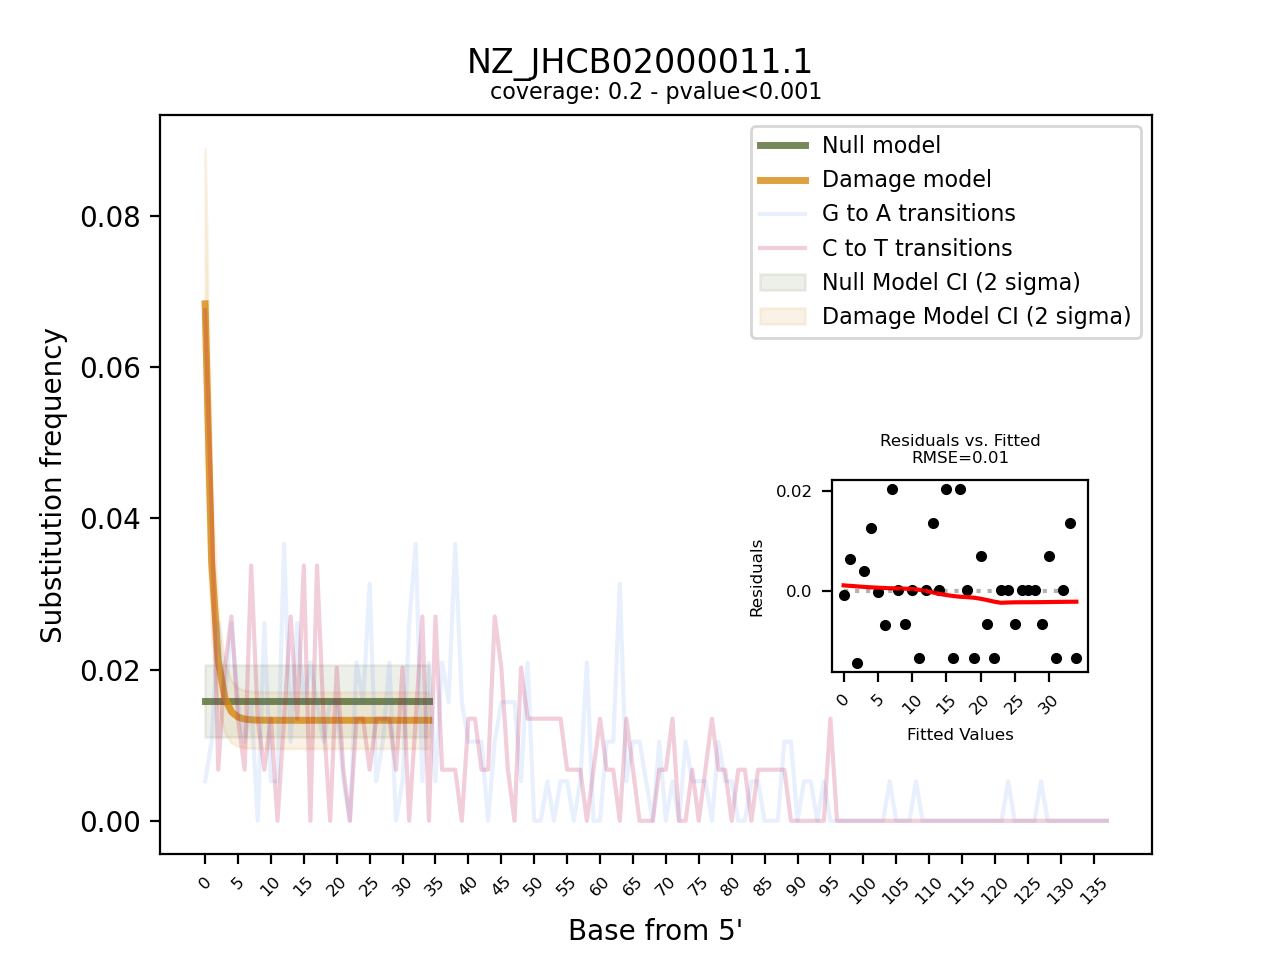
The visual output are PNG files, one per reference contig. They show the frequency of observed C to T, and G to A transition at the 5’ end of the sequencing data and overlay it with the fitted models for both the null and the damage model, including 95% confidence intervals. Furthermore, it provides a “residuals versus fitted” plot to help evaluate the fit of the pydamage damage model. Finally, the plot contains informtion on the average coverage along the reference and the p-value calculated from the likelihood-ratio test-statistic using a chi-squared distribution.
The visual output is only produced when using the
--plotflag